
This project takes a closer look at how SUGAR uses Instagram — from content style and posting patterns to influencer collaborations and audience engagement — to build brand visibility and drive sales. By analyzing real data points such as engagement rates, content themes, and follower interaction trends, this study aims to uncover the strategic choices behind SUGAR’s social media success and what other emerging brands can learn from it.
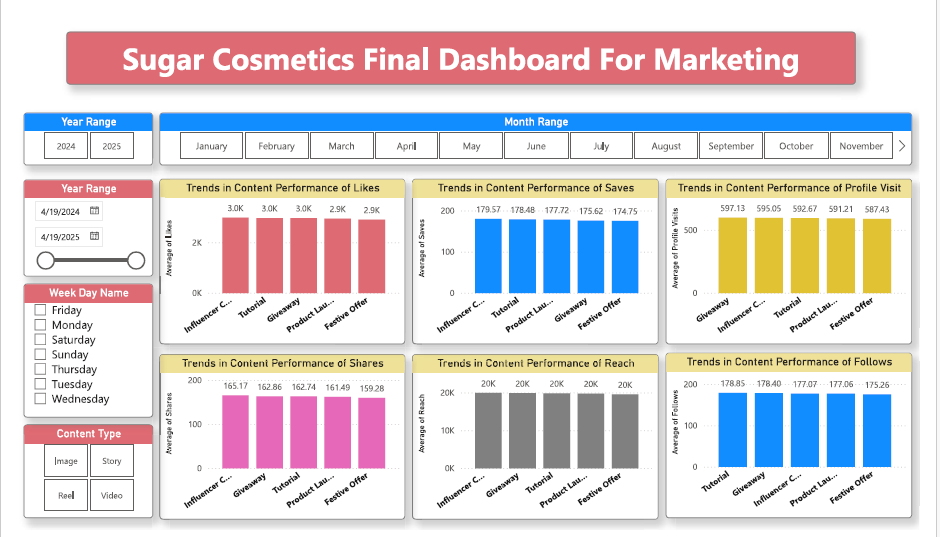
OVERVIEW KPIS – BRAND’S INSTAGRAM SUMMARY
Total number of posts: 50 Thousand
Total likes received: 148 Million
Total comments received: 18 Million
Total reach: 987 Million
Average engagement rate (): 14.34
Engagement rate Formula: (Likes + Comments + Saves) / Reach × 100
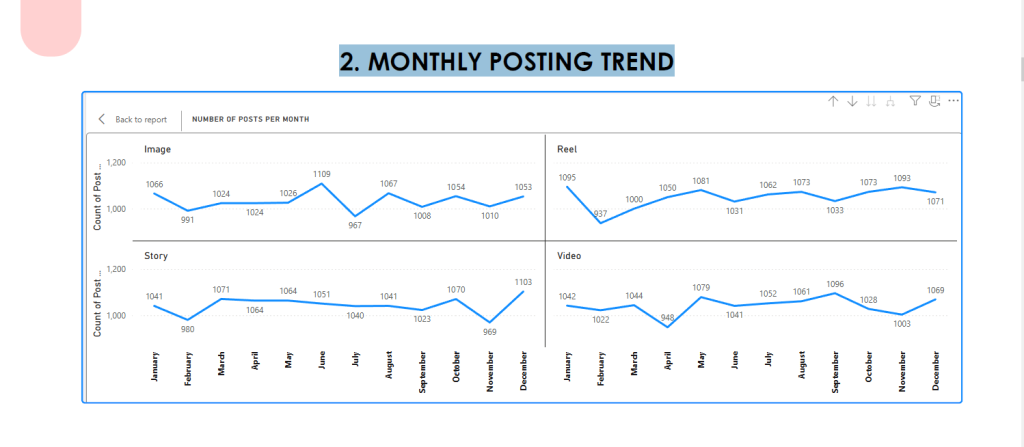
MONTHLY POSTING TREND
Analysis
The monthly posting trends show that June, followed by August, had high image posting.
September and October, image/story/reel 3 types of content postings are increasing.
From November to December, image/story/video posting is high, but reel posting is low.
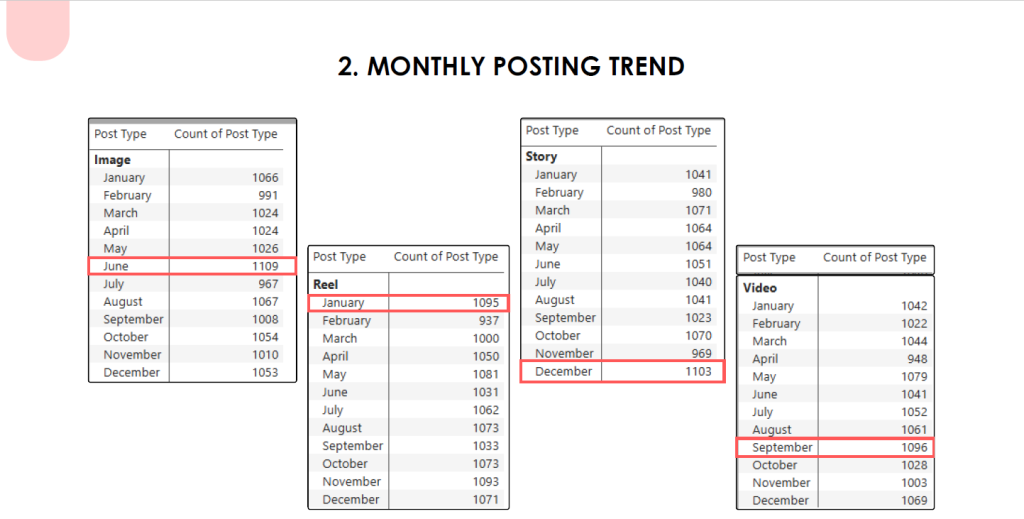
It’s clear from the analysis report that from September to December, due to Diwali, Christmas, and New Year, content posting gradually increased. From April to June, more or less content posting graph moves upward due to summer marketing.
Top 10 Posts by Engaugement Rate
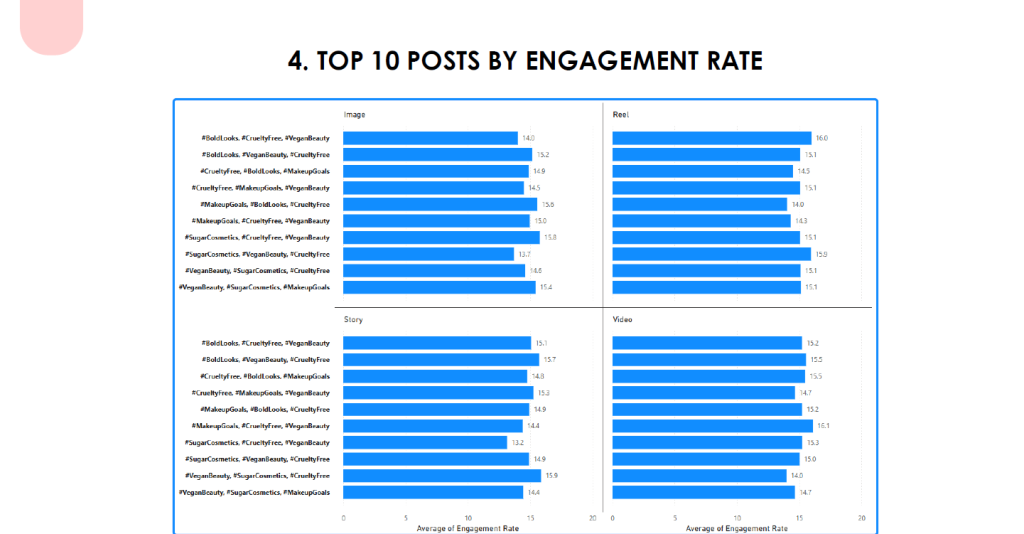
Top-performing hashtag for every type of content: #cruelty Free apart from that
For images and videos—#sugarCosmetics, #veganbeauty perform top
For stories and reels—#BloodLooks, #MakeupGoals
So from this analysis we get that the Gen Z generation (which are SUGAR’s main customers) are more interested in cruelty-free products; that’s why they like vegan beauty products, and they are also inclined towards bold looks and appearances.
SUGAR Cosmetics: Brand Story to Marketing Success Overview.
8 AI Analytics Tools for Real Time Data Analysis
Recommendation
Mix & rebalance
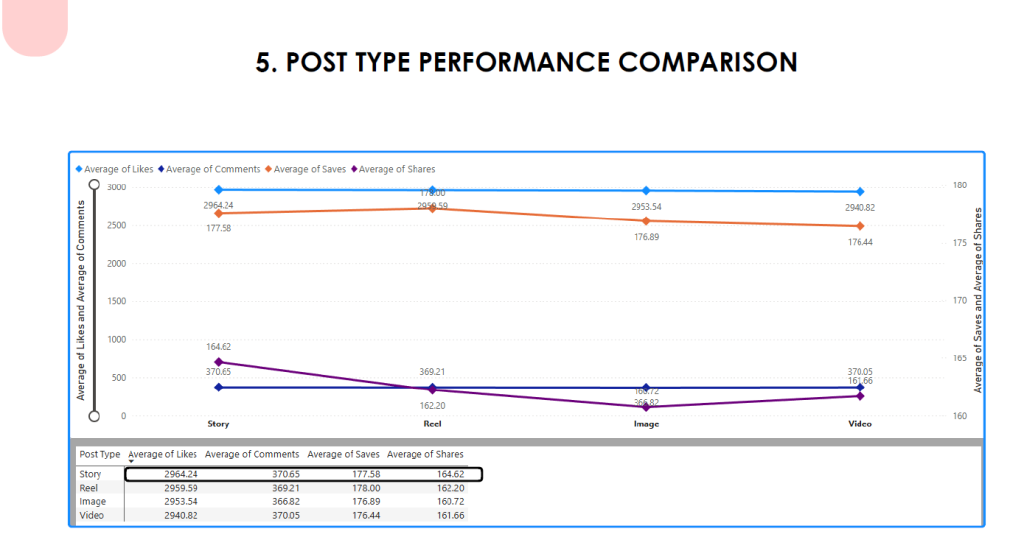
Reduce image-only volume by ~20–30% and reallocate that content budget to Reels (video) and Stories. Data
shows Reels → top impressions & saves; Stories → high saves & likes.
Frequency (baseline)
Reels: 1–3/week (focus on 60–90s, product demos, transitions).
Feed (Image/Carousel): 3–5/week (product shots, reviews, carousel tutorials).
Stories: Daily (behind-the-scenes, polls, UGC re-shares, 3–6 per day).
Live/Shopping sessions: 2–4 per month.
Timing (use weekday table as primary source)
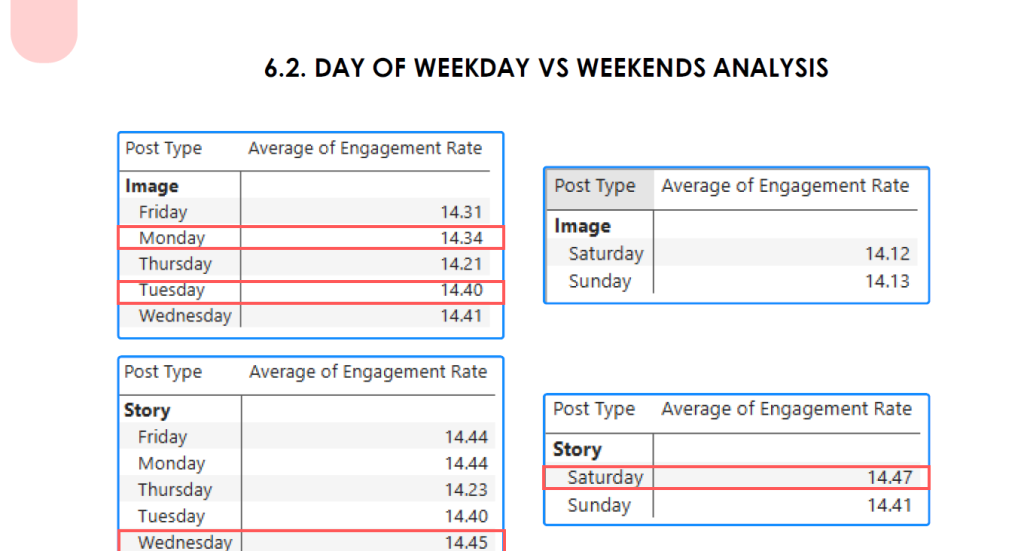
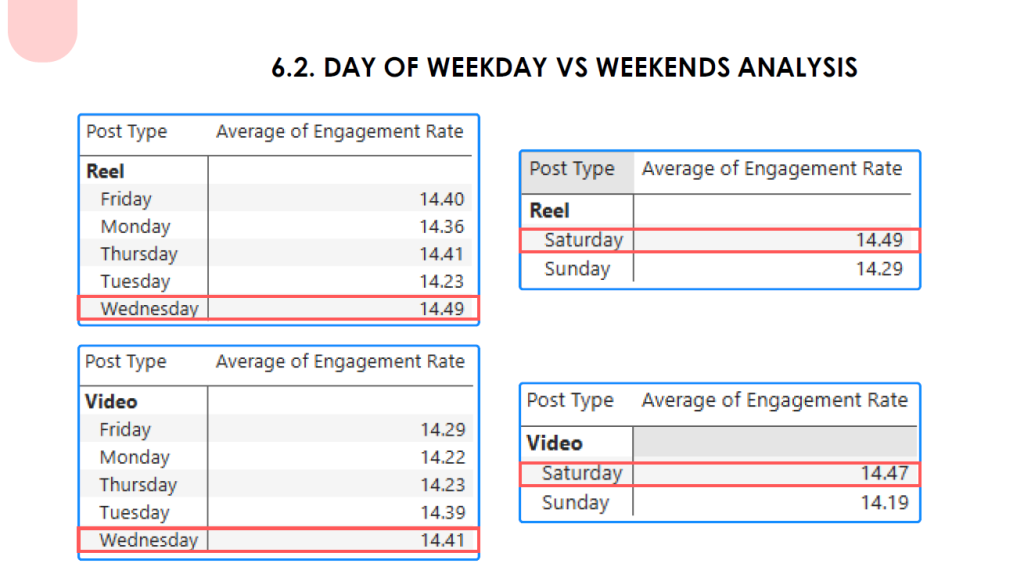
Post highest-priority Reels and promotional posts on the top weekdays from the weekday table.
In India (IST) standard peak windows: 11:00–14:00 (lunch scroll) and 18:30–22:30 (prime engagement) — test
exact hours within these windows using A/B slices.
Content type priorities
Reels: Product tutorials, transformations, micro-tutorials, influencer takeovers.
Stories: CTAs, polls, quick swatches, “shop now” stickers.
Carousel: Multi-product features, step-by-step looks, comparison guides.
Images: Hero product shots, UGC highlights — use less frequently but high quality.
Suggestions to Improve Engagement & Follower Growth
Hashtag & caption play
Lead with top-performing hashtags found in your data: #VeganBeauty, #SugarCosmetics, #MakeupGoals, #BoldLooks, CrueltyFree. Rotate combinations to avoid repetition.
Use captions that include a simple CTA (e.g., “Which shade — A or B? Comment below!”) — prompts lift comments
and saves.
UGC & community-driven content
Run a monthly “BoldLooks” UGC contest — reshare best UGC in stories and feature winners on feed. UGC increases
saves/shares and authentic reach.
Micro-influencer seeding
Partner with many micro-influencers (5–15K followers) for authentic reach; they often give higher engagement-to-cost
ROI than one macro influencer.
Interactive Stories
Polls, quizzes, “this or that” and swipe-up (or link sticker) CTAs to increase story completion and click-throughs.
Cross-promotion & email capture
Use posts/stories to drive traffic to limited-time bundles and collect emails with exclusive offers — grows owned
audience.
Gaps Identified & How to Address Them
Over-reliance on static images
Gap: Images dominate monthly output (~1000+/month) but Reels/Stories drive impressions and saves.
Fix: Reallocate 20–30% of image volume to Reels & Stories; repurpose image content into 15–30s clips or
animated carousels.
Uneven content-to-conversion pipeline
Gap: High likes/saves but unclear conversion tactics in dataset.
Fix: Add tracking UTM parameters + conversion pixels to campaign posts, and measure clicks → cart adds →
orders per post type.
Hashtag / caption fatigue
Gap: Same top hashtags recirculating — can reduce reach due to repetition.
Fix: Maintain a rotating hashtag library (3 tiers: primary, secondary, niche) and test alternate combos weekly.
Insufficient testing of posting times by segment
Gap: Weekday-level insight exists but hourly A/B testing not visible.
Fix: Run 2-week A/B time blocks (e.g., 19:00 vs 21:00) for Reels and measure 7-day engagement lift.
Proposed Content & Campaign Ideas (Aligned to Brand)
“Bold Vegan Looks” 4-week challenge
Weekly theme (eyes, lips, base, finishing) with UGC submission; winners get feature + kit.
KPI: UGC entries, saves, follower lift.
“Cruelty-Free Starter Kit” micro-campaign
Bundle target for first-time buyers; promote via Reels (how to use) + Stories (swipe to shop).
KPI: conversion rate, add-to-carts.
Influencer Mini-Series: “7 Days, 7 Looks”
Micro-influencers create daily 15–30s Reels showing looks using a single palette; aggregate into highlights.
KPI: reach, saves, follower growth.
Region-targeted promos
Use best-performing hashtags and localized captions for high-potential regions (use sales/geo data to target).
KPI: regional sales lift.
Summery:
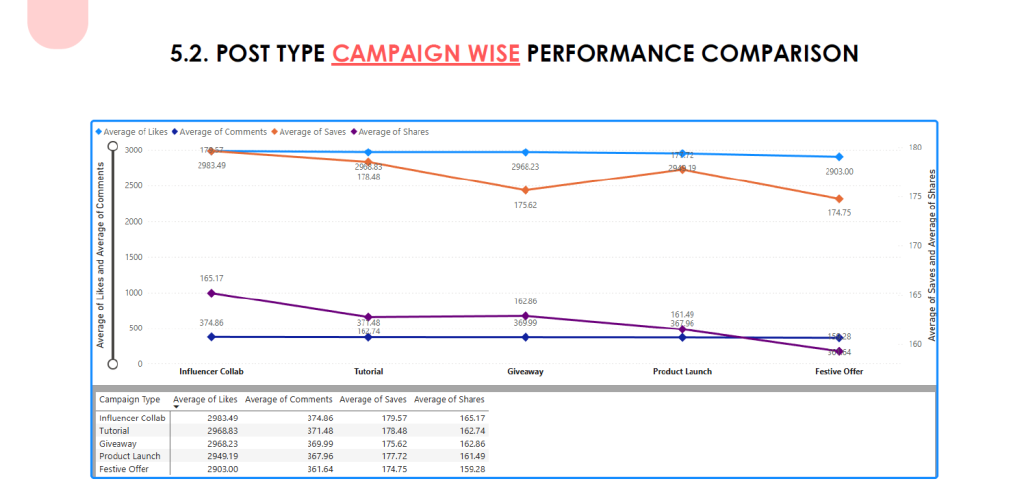
Analysis of Sugar Cosmetics’ campaign data reveals that Reels and Influencer-led content consistently achieve the highest reach, impressions, and engagement rates, particularly on weekdays.
Hashtag-rich posts and product launch campaigns outperform generic content.
Engagement rates are higher for makeup tutorials, reviews, and before-after visuals compared to static images.
Monthly posting frequency remains balanced, maintaining steady visibility.
Overall, short-form video content dominates performance across all metrics, while audience activity peaks during weekdays, highlighting strong engagement opportunities for brand-driven storytelling and influencer collaborations.
Concusion:
Sugar Cosmetics should prioritize Reels and influencer collaborations as their main growth drivers.
Scheduling key posts (image/reels/videos) on weekdays can maximize audience interaction, while consistent use of strategic hashtags will further boost organic reach. Creating more educational and transformation-based videos can strengthen emotional connection and engagement.
Reducing focus on static image posts and investing in video-centric storytelling will enhance campaign ROI.
Sustaining consistent posting frequency while optimizing for trending formats will ensure continued visibility, stronger brand recall, and improved conversion potential across social media platforms.